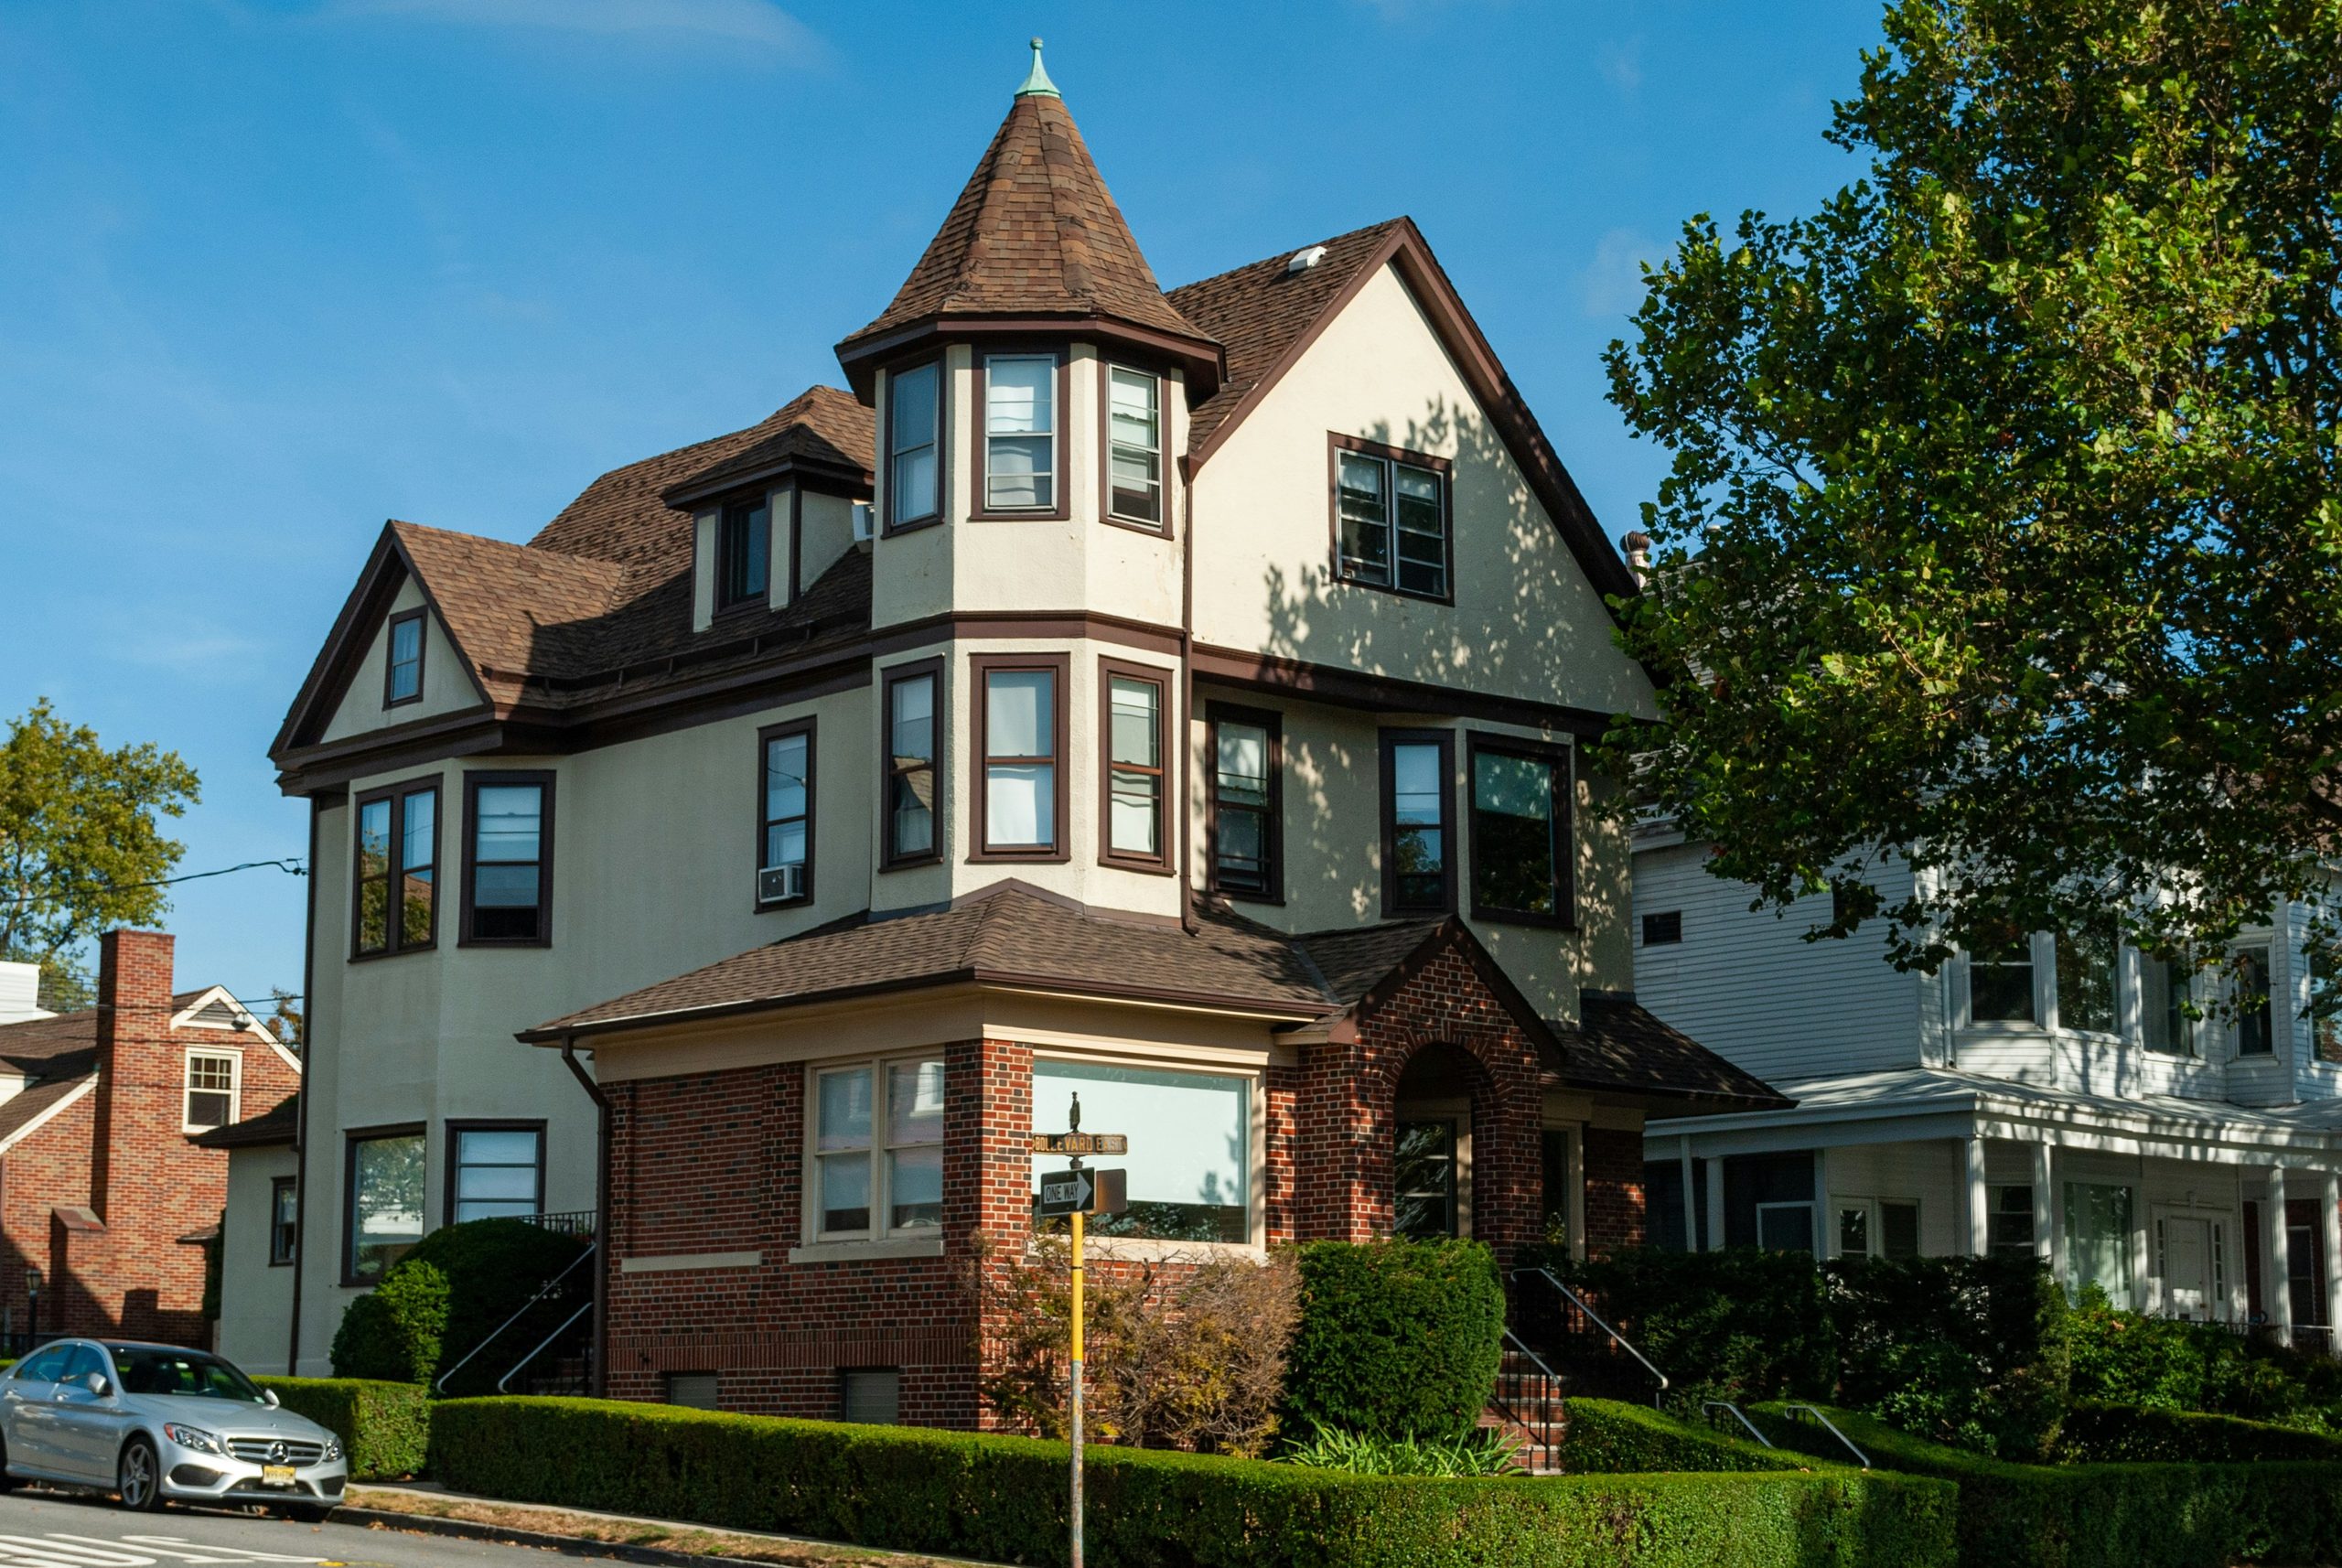
As the fall season approaches, the real estate markets in Maplewood, NJ, and its sister town of South Orange, NJ, continue to show robust activity, with prices and demand significantly ahead of last year, according to the weekly market data tracked by Mark Slade Homes. Mark Slade, who leverages his economics background to develop the 'hyper market index,' provides a real-time snapshot of market conditions. The latest data, for the week ending August 23, reveals where each town stands as the year progresses.
The hyper market index compares the number of homes under contract to active listings. A ratio above 1.0 indicates a hyper market, where demand outstrips supply. Slade tracks this metric weekly across seven towns, calculating average sale price, percentage over asking, and days on market. He believes this method offers a more accurate picture of buyer activity than traditional absorption rates, which can be skewed by seasonality.
Montclair leads the group with 191 homes sold, an average sale price of $1,512,172, and homes selling 22.5% over asking. Properties there average just 17.4 days on market, and the hyper market index stands at 1.9, the highest among the tracked towns. Maplewood follows with 137 sales from same-year listings, an average price of $1,304,556, and 16.4% over asking. Homes in Maplewood are moving fastest, at 13.6 days on market, with an index of 1.2. South Orange shows 86 solds, an average price of $1,230,401, 15.8% over asking, and a higher index of 1.6, indicating stronger relative demand.
Other towns show varied performance. West Orange has 239 solds with an average price of $768,749 and 10.6% over asking, with an index of 1.2. Union has 198 solds at $602,239, 4.2% over asking, and an index of 1.0. Livingston, however, remains the softest market with 156 solds, an average price of $1,399,451, and only 3.2% over asking. Its index of 0.7 indicates more active listings than homes under contract, and days on market average 20.2. Rahway, the newest addition to the tracking, is softer still at 1.2% over asking and a 0.3 index.
Year-to-date, Maplewood has closed 156 sales, with 137 of those from listings taken this year, indicating minimal carryover inventory. In contrast, Livingston's 204 closings include a larger share of older listings, which contributes to its weaker pricing power. Slade also tracks exclusive listings—homes sold without full market exposure. In Livingston, exclusives account for 10.8% of closings, compared to 2-6% in other towns, further softening its price metrics.
Compared to 2025, 2026 is outperforming across the board. Maplewood's closed sales represent 87.8% of its year-to-date total from 2025, with higher prices and more over-asking sales. South Orange is at 84.9% of last year's pace with similar gains. West Orange and Montclair are strong at 80.5% and 88.4%, respectively, while Livingston lags at 76.5%.
For sellers contemplating whether to list before Labor Day or wait, Slade advises waiting until the week after Labor Day. Listing during Labor Day week competes with back-to-school activities, diverting buyer attention. Waiting a week allows families to settle in, historically yielding better results for sellers. Those interested in following these trends can check the Blog for ongoing updates.
Mark Slade and MaryCeu Nunes lead a top-producing Keller Williams real estate team serving Maplewood, South Orange, and surrounding communities, with over $500 million in lifetime sales across 54 New Jersey municipalities.